
Customer churn and retention
Track customer retention and churn from Bitrix24 repeat purchases
免費
-
評分
-
安裝95351
-
開發人員Alaio, inc
描述
Customer Retention and Churn shows how many customers return for repeat purchases and how many are lost over time. It is built for managers in businesses where repeat sales drive revenue and retention directly impacts profitability.
Why businesses use it
Acquiring new customers costs more than keeping existing ones. Managers need to see retention and churn patterns to understand whether their customer base is growing, shrinking, or stable — and act before problems compound.
Business value
• Track retention and churn dynamics over time in one view
• Analyze retention rates broken down by period
• Identify which managers or pipelines have the strongest retention
• See a detailed customer list with retention status
Common use cases
• Monitor whether customer retention is improving or declining over time
• Identify periods with unusually high churn
• Compare retention rates across managers to find best practices
• Review the customer list to identify at-risk or recently churned clients
How it works
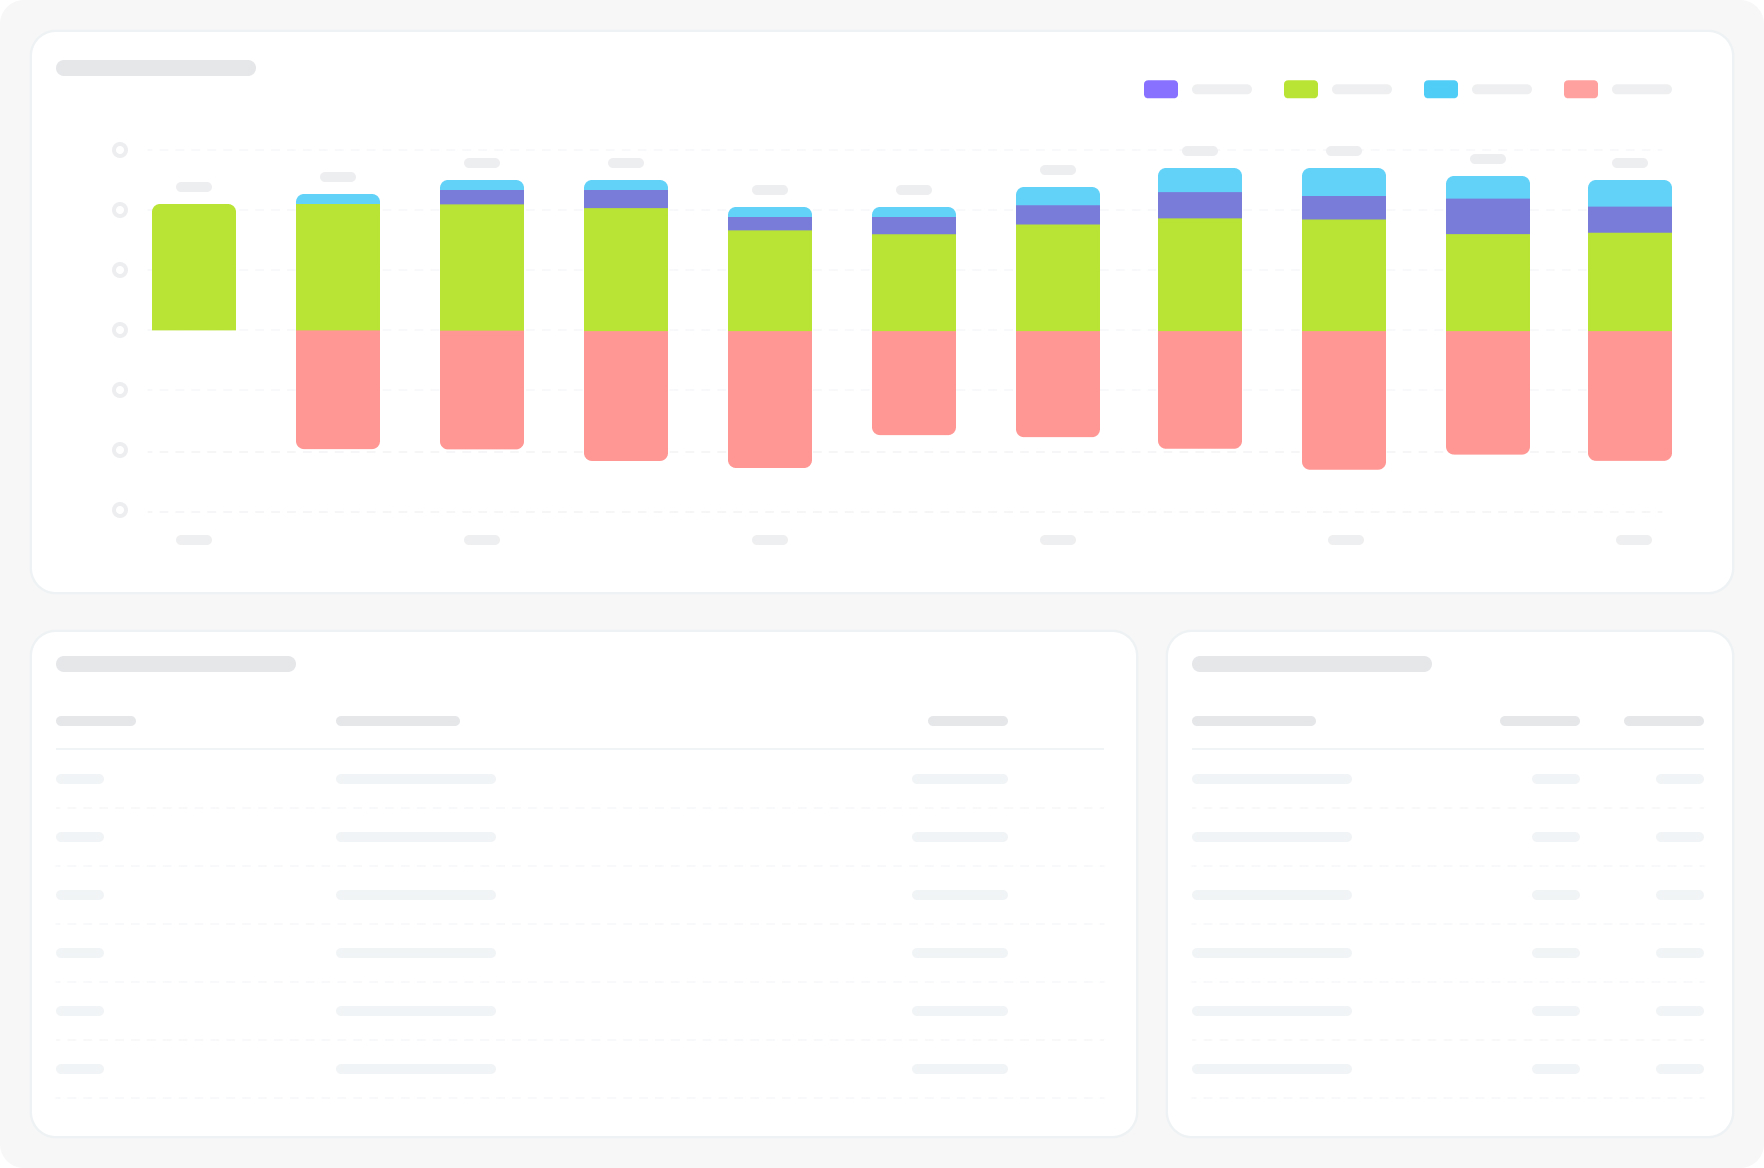
Retention is determined by the presence of repeat closed deals with the same counterparty. The dashboard connects to Bitrix24 deal data and presents three visualizations: a retention and churn dynamics bar chart, a retention-by-period pivot table, and a customer list with retention status. Filters: Period, Manager, Pipeline.
FAQ
We don't know how many customers actually come back for a second purchase. Is there a simple way to see that here?
Yes — the retention and churn dynamics chart shows how many customers returned versus how many did not, by period. The retention table breaks it down period by period so you can track the trend.
Customer churn feels like it's getting worse but we can't quantify it. How do we measure the scale of the problem?
Compare retention rates across periods in the pivot table. A declining trend confirms the problem — and you can filter by manager or pipeline to see whether it's concentrated in a specific area.
We want to identify which specific customers have churned so we can reach out. Where do we find that list?
The customer list table shows every counterparty with their retention status — use it to pull the churned segment for re-engagement campaigns.
What is needed to connect to Bitrix24?
Access credentials for the Bitrix24 BI connector, configured during app installation.
Why businesses use it
Acquiring new customers costs more than keeping existing ones. Managers need to see retention and churn patterns to understand whether their customer base is growing, shrinking, or stable — and act before problems compound.
Business value
• Track retention and churn dynamics over time in one view
• Analyze retention rates broken down by period
• Identify which managers or pipelines have the strongest retention
• See a detailed customer list with retention status
Common use cases
• Monitor whether customer retention is improving or declining over time
• Identify periods with unusually high churn
• Compare retention rates across managers to find best practices
• Review the customer list to identify at-risk or recently churned clients
How it works
Retention is determined by the presence of repeat closed deals with the same counterparty. The dashboard connects to Bitrix24 deal data and presents three visualizations: a retention and churn dynamics bar chart, a retention-by-period pivot table, and a customer list with retention status. Filters: Period, Manager, Pipeline.
FAQ
We don't know how many customers actually come back for a second purchase. Is there a simple way to see that here?
Yes — the retention and churn dynamics chart shows how many customers returned versus how many did not, by period. The retention table breaks it down period by period so you can track the trend.
Customer churn feels like it's getting worse but we can't quantify it. How do we measure the scale of the problem?
Compare retention rates across periods in the pivot table. A declining trend confirms the problem — and you can filter by manager or pipeline to see whether it's concentrated in a specific area.
We want to identify which specific customers have churned so we can reach out. Where do we find that list?
The customer list table shows every counterparty with their retention status — use it to pull the churned segment for re-engagement campaigns.
What is needed to connect to Bitrix24?
Access credentials for the Bitrix24 BI connector, configured during app installation.


