
Deal analytics
Get a full-depth view of your Bitrix24 deal pipeline in one dashboard
免費
-
評分
-
安裝102158
-
開發人員Alaio, inc
描述
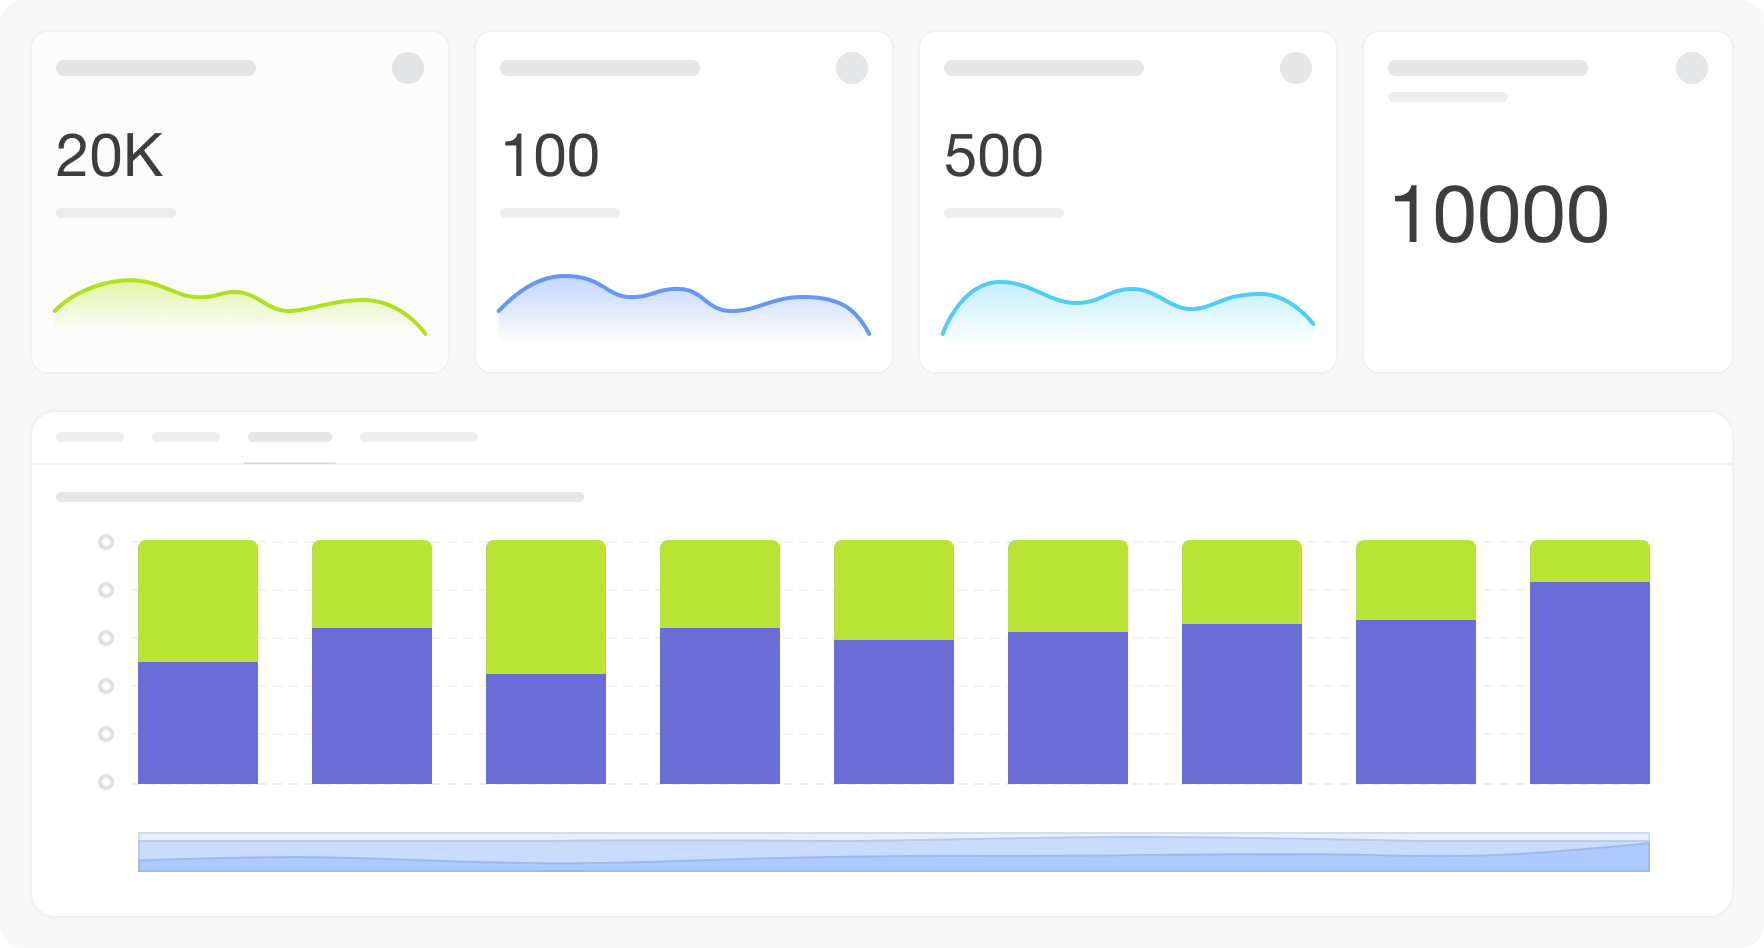
Complex Deal Analytics gives sales managers a comprehensive, multi-dimensional view of the deal pipeline — revenue dynamics, conversion, source attribution, manager performance, and deal forecasting — all in one place.
Why businesses use it
Standard deal reports show one dimension at a time. Sales managers need to see revenue trends, source performance, manager results, and pipeline forecast simultaneously to make informed decisions without switching between reports.
Business value
• Monitor revenue, conversion, and average deal metrics across all key dimensions
• Analyze deal performance by source and responsible manager in one view
• Forecast deal volume and revenue by expected close date
• Compare revenue year-over-year and on a cumulative basis
Common use cases
• Review cross-dimensional deal performance in weekly sales meetings
• Identify which sources and managers are driving the best conversion rates
• Check the forecast of deals expected to close in the coming period
• Compare year-over-year revenue trends with deal-level detail
How it works
The dashboard connects to the crm_deal table. Twenty-two visualizations cover KPI cards, revenue dynamics, year-over-year comparisons, deal distribution by source, manager performance tables, expected close date forecasts, and deal lists. Filters: Period, Grouping, Responsible person, Pipeline.
FAQ
Our weekly sales meetings pull data fr om multiple reports and still don't give a complete picture. Can one dashboard cover it?
Yes — this dashboard combines revenue trends, year-over-year comparison, source attribution, manager performance, and pipeline forecast in a single view designed for exactly that use case.
We know total revenue but can't tell which sources or managers are driving it. Wh ere do I find that breakdown?
The conversion and revenue by responsible table and the conversion by source table give you both dimensions simultaneously — with conversion rates alongside revenue, not just headcounts.
We want to see what's in the pipeline for next month, but in-progress deals are scattered. Is there a consolidated forecast view?
The "quantity and amount of deals by expected close date" chart shows the in-progress deal portfolio distributed by their planned close dates — a direct pipeline forecast from CRM data.
What is needed to connect to Bitrix24?
Access credentials for the Bitrix24 BI connector, configured during app installation.
Why businesses use it
Standard deal reports show one dimension at a time. Sales managers need to see revenue trends, source performance, manager results, and pipeline forecast simultaneously to make informed decisions without switching between reports.
Business value
• Monitor revenue, conversion, and average deal metrics across all key dimensions
• Analyze deal performance by source and responsible manager in one view
• Forecast deal volume and revenue by expected close date
• Compare revenue year-over-year and on a cumulative basis
Common use cases
• Review cross-dimensional deal performance in weekly sales meetings
• Identify which sources and managers are driving the best conversion rates
• Check the forecast of deals expected to close in the coming period
• Compare year-over-year revenue trends with deal-level detail
How it works
The dashboard connects to the crm_deal table. Twenty-two visualizations cover KPI cards, revenue dynamics, year-over-year comparisons, deal distribution by source, manager performance tables, expected close date forecasts, and deal lists. Filters: Period, Grouping, Responsible person, Pipeline.
FAQ
Our weekly sales meetings pull data fr om multiple reports and still don't give a complete picture. Can one dashboard cover it?
Yes — this dashboard combines revenue trends, year-over-year comparison, source attribution, manager performance, and pipeline forecast in a single view designed for exactly that use case.
We know total revenue but can't tell which sources or managers are driving it. Wh ere do I find that breakdown?
The conversion and revenue by responsible table and the conversion by source table give you both dimensions simultaneously — with conversion rates alongside revenue, not just headcounts.
We want to see what's in the pipeline for next month, but in-progress deals are scattered. Is there a consolidated forecast view?
The "quantity and amount of deals by expected close date" chart shows the in-progress deal portfolio distributed by their planned close dates — a direct pipeline forecast from CRM data.
What is needed to connect to Bitrix24?
Access credentials for the Bitrix24 BI connector, configured during app installation.

版本歷程
版本 4
bug fixes
03.07.2026
版本 3
bug fixes
22.12.2025
版本 2
bug fixes
05.12.2025


