
Tasks: completion time
Track task deadline compliance and completion speed in Bitrix24
免費
-
評分
-
安裝74830
-
開發人員Alaio, inc
描述
Task Completion Speed helps managers understand how quickly tasks are completed and whether deadlines are being met. It classifies closed tasks by completion timing and shows overdue rates and accumulated delay across the team.
Why businesses use it
Deadline compliance is a direct indicator of execution quality. Without visibility into overdue rates and completion timing, managers cannot spot patterns or identify which employees consistently finish tasks on time or late.
Business value
• Classify closed tasks by completion speed: completed early, on time, at the last moment, or overdue
• Track overdue task rate dynamics over time
• Measure total accumulated days of delay
• See completion timing and overdue statistics broken down by assignee
Common use cases
• Review whether deadline compliance is improving or declining over time
• Identify employees with consistently high overdue rates
• Measure total accumulated overdue days to quantify delay impact
• Filter results by department, assignee, or whether deadline changes are allowed
How it works
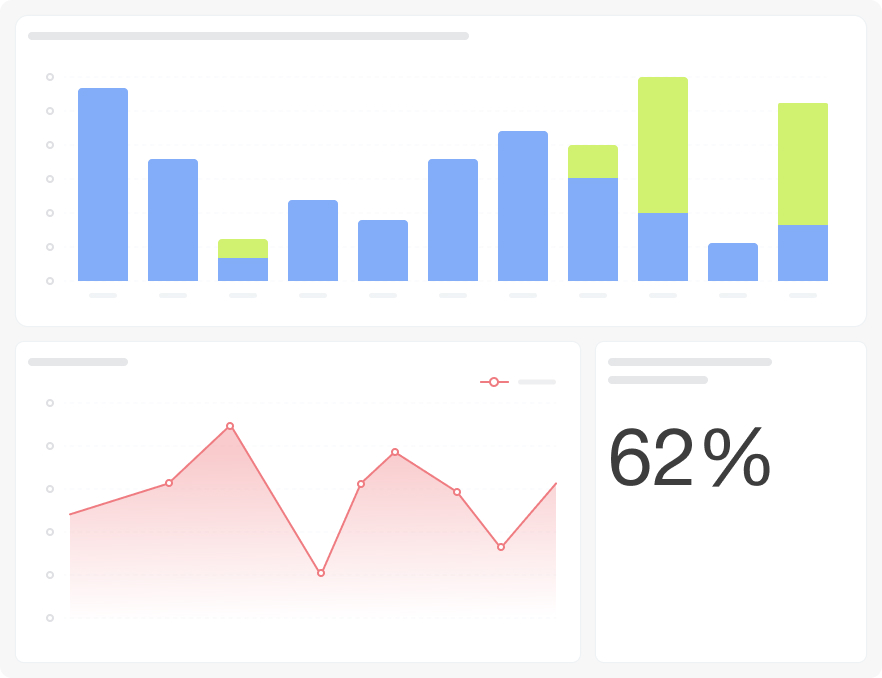
The dashboard connects to Bitrix24 task data. Ten visualizations cover a task duration pie chart (completed early / on time / at the last moment / overdue), overdue rate dynamics line chart, four KPI cards (completed quickly, on time, at the last moment, overdue), total days spent on tasks bar chart, completion time bar charts, and an assignee statistics table. Filters: Completion Period, Grouping, Department, Assignee, Allow deadline changes.
FAQ
We have a feeling deadlines are being missed more often lately but don't have data to confirm it. Will this show that?
Yes — the overdue rate dynamics line chart shows how the percentage of overdue tasks changes over time. A rising trend confirms the issue and anchors a conversation with the team.
I need to quantify the total impact of deadline violations, not just the count. Is there a metric for that?
The "total accumulated days" KPI sums all excess days across every overdue task in the period — giving you a concrete number that reflects the true cost of delays.
I want to identify which employees consistently miss deadlines without reviewing each person manually. How?
The assignee statistics table shows completion timing and overdue rates per employee, so you can spot patterns across the team in one view.
What is needed to connect to Bitrix24?
Access credentials for the Bitrix24 BI connector, configured during app installation.
Why businesses use it
Deadline compliance is a direct indicator of execution quality. Without visibility into overdue rates and completion timing, managers cannot spot patterns or identify which employees consistently finish tasks on time or late.
Business value
• Classify closed tasks by completion speed: completed early, on time, at the last moment, or overdue
• Track overdue task rate dynamics over time
• Measure total accumulated days of delay
• See completion timing and overdue statistics broken down by assignee
Common use cases
• Review whether deadline compliance is improving or declining over time
• Identify employees with consistently high overdue rates
• Measure total accumulated overdue days to quantify delay impact
• Filter results by department, assignee, or whether deadline changes are allowed
How it works
The dashboard connects to Bitrix24 task data. Ten visualizations cover a task duration pie chart (completed early / on time / at the last moment / overdue), overdue rate dynamics line chart, four KPI cards (completed quickly, on time, at the last moment, overdue), total days spent on tasks bar chart, completion time bar charts, and an assignee statistics table. Filters: Completion Period, Grouping, Department, Assignee, Allow deadline changes.
FAQ
We have a feeling deadlines are being missed more often lately but don't have data to confirm it. Will this show that?
Yes — the overdue rate dynamics line chart shows how the percentage of overdue tasks changes over time. A rising trend confirms the issue and anchors a conversation with the team.
I need to quantify the total impact of deadline violations, not just the count. Is there a metric for that?
The "total accumulated days" KPI sums all excess days across every overdue task in the period — giving you a concrete number that reflects the true cost of delays.
I want to identify which employees consistently miss deadlines without reviewing each person manually. How?
The assignee statistics table shows completion timing and overdue rates per employee, so you can spot patterns across the team in one view.
What is needed to connect to Bitrix24?
Access credentials for the Bitrix24 BI connector, configured during app installation.

版本歷程
版本 3
bug fixes
03.07.2026
版本 2
bug fixes
05.12.2025


