
Workflow statistics
Track execution dynamics for a specific business process in Bitrix24
免費
-
評分
-
安裝14884
-
開發人員Alaio, inc
描述
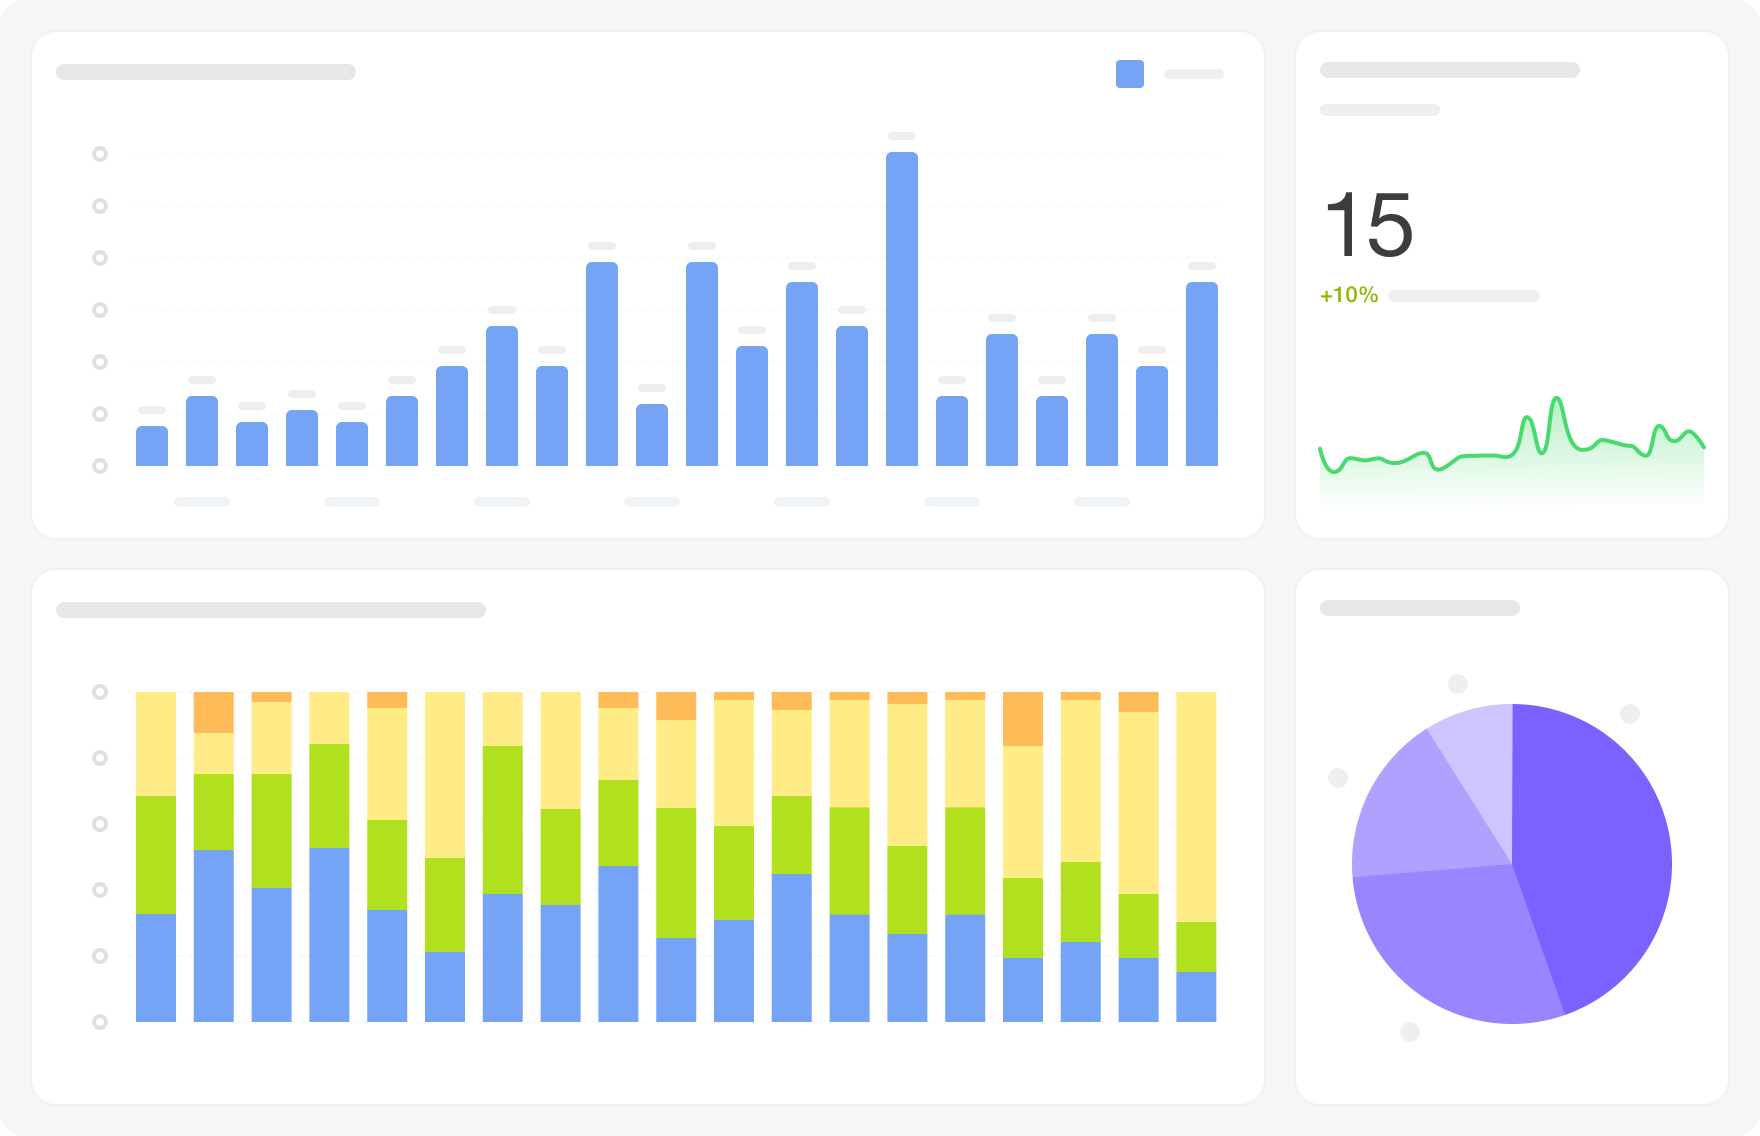
Business Process Execution Dynamics shows how a selected business process performs over time — how many instances are running, completing successfully, and how long execution takes. It is built for process owners who need to monitor a specific process rather than all processes at once.
Why businesses use it
Monitoring a single business process in detail requires more than a general overview. Process owners need to see execution counts, completion rates, and timing trends for one process so they can spot slowdowns or spikes quickly.
Business value
The dashboard connects to Bitrix24 business process data and is filtered to a specific process. Nine visualizations cover execution dynamics, completion rates, duration trends, and status breakdowns. Filters: Period, Grouping.
FAQ
Why businesses use it
Monitoring a single business process in detail requires more than a general overview. Process owners need to see execution counts, completion rates, and timing trends for one process so they can spot slowdowns or spikes quickly.
Business value
- Track launched and completed instances of a specific process over time
- Monitor average execution duration trends
- See success and failure rates for the selected process
- Compare execution volume across periods
- Monitor a key onboarding or approval process week by week
- Detect increases in average execution time that signal bottlenecks
- Check whether a process change improved completion rates
- Review execution volume trends over a quarter
The dashboard connects to Bitrix24 business process data and is filtered to a specific process. Nine visualizations cover execution dynamics, completion rates, duration trends, and status breakdowns. Filters: Period, Grouping.
FAQ
- We changed a business process last month and want to know if it actually got faster. How do we check?
- Our process launch count dropped unexpectedly and we don't know why. Where do we look first?
- We need to report on the health of a specific automated process but don't have a clean way to present the data. Will this work?
- What is needed to connect to Bitrix24?

版本歷程
版本 3
bug fixes
25.06.2026
版本 2
bug fixes
05.12.2025


