
Flow tasks and efficiency
Analyze load and effectiveness across all Bitrix24 Flows
免费
-
评分
-
安装数13630
-
开发人员Alaio, inc
描述
Flows: Load and Effectiveness Analysis gives managers a cross-flow view of task execution, assignee workload, and completion effectiveness across all active Bitrix24 Flows. It helps operations leads understand which flows are running well and where completion rates or workload distribution need attention.
Why businesses use it
Teams using multiple Flows need a way to compare performance across them. Without a unified view, it is hard to see which flows have low effectiveness, which assignees carry the most work, and how the volume of tasks in progress changes over time.
Business value
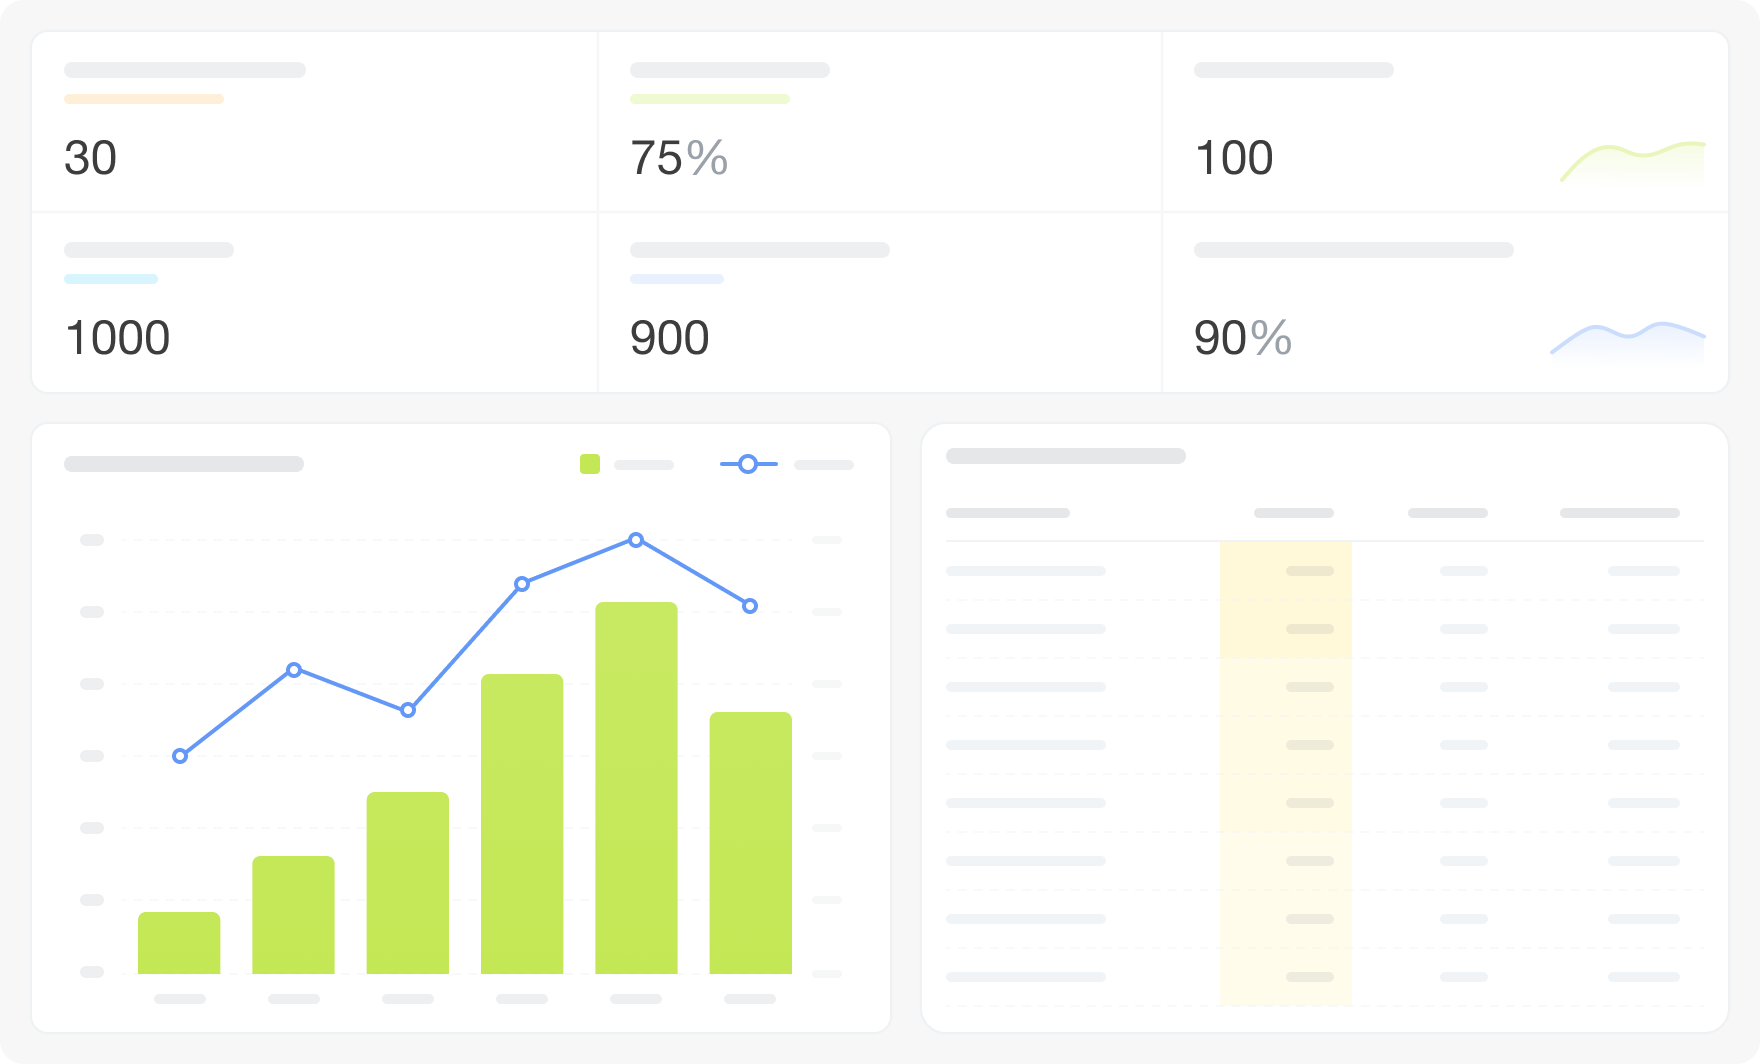
The dashboard connects to Bitrix24 Flows task data. Twenty-two visualizations cover: average effectiveness KPI, average task execution time, average tasks per assignee, completed tasks KPI, effectiveness by day and by assignee, assignee load tables (in-flow and out-of-flow), completed task summary, flow count KPI, effectiveness by month, last-30-days summary, tasks-in-progress dynamics, out-of-flow tasks, completion percentage KPI, execution statistics tables, top-10 flow loaders, total tasks KPI, and uncompleted task summary. Filters: Period, Grouping, Flow Creator, Flow Administrator, Flow Name, Task Assignee, Assignee Department, Task Assigner, Assigner Department.
FAQ
Why businesses use it
Teams using multiple Flows need a way to compare performance across them. Without a unified view, it is hard to see which flows have low effectiveness, which assignees carry the most work, and how the volume of tasks in progress changes over time.
Business value
- Track average effectiveness, completed task count, and percentage of completed tasks across flows
- Compare assignee workload and effectiveness across all flows
- Monitor tasks outside of flows alongside flow task volume
- Identify which creators and assigners generate the most flow load (top-10)
- Review which flows have the lowest completion rates
- Identify overloaded assignees across all flows
- Check the summary of completed and uncompleted tasks per flow
- Compare flow effectiveness by month and by day
The dashboard connects to Bitrix24 Flows task data. Twenty-two visualizations cover: average effectiveness KPI, average task execution time, average tasks per assignee, completed tasks KPI, effectiveness by day and by assignee, assignee load tables (in-flow and out-of-flow), completed task summary, flow count KPI, effectiveness by month, last-30-days summary, tasks-in-progress dynamics, out-of-flow tasks, completion percentage KPI, execution statistics tables, top-10 flow loaders, total tasks KPI, and uncompleted task summary. Filters: Period, Grouping, Flow Creator, Flow Administrator, Flow Name, Task Assignee, Assignee Department, Task Assigner, Assigner Department.
FAQ
- We have several flows running simultaneously and no way to compare how they're performing against each other. Can this show that?
- Some assignees seem to be carrying significantly more flow work than others, but we can't prove it. How do we see that?
- Tasks are being done outside our flows and we're not sure how significant that is. Where does this show up?
- What is needed to connect to Bitrix24?


