Deal analytics
Analyze deals and identify tight spots that may need improvement.
免费
-
评分
-
安装数99782
-
开发人员Bitrix24
描述
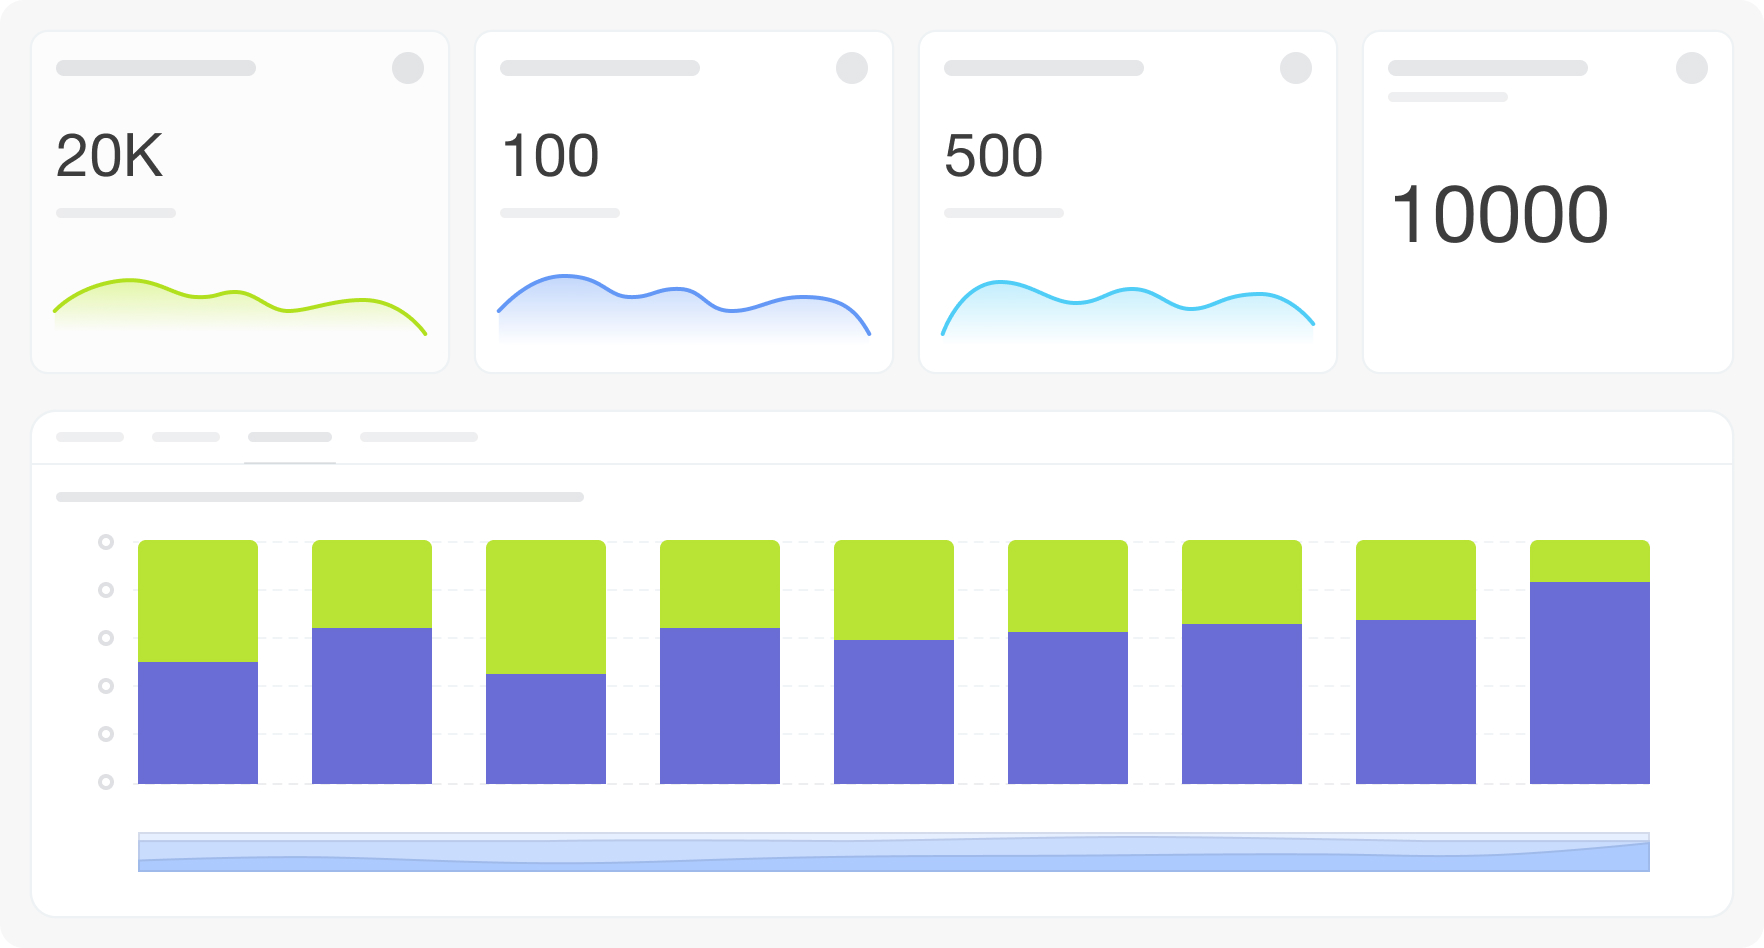
Use charts in this dashboard to understand sales trend over a specified time period. Learn how
deals and revenues change over time and identify sources that brought about the most successful
deals.
Charts in this dashboard:
This report is provided as a BI Builder dashboard. Standard dashboards are installed on demand;
the installation does not require user input. Once installed, the dashboards will be available in the
menu if BI Builder is available on your plan.
deals and revenues change over time and identify sources that brought about the most successful
deals.
Charts in this dashboard:
- Deals in progress
- Completed deals
- Conversion by source and responsible person
- Revenue by source and responsible person
This report is provided as a BI Builder dashboard. Standard dashboards are installed on demand;
the installation does not require user input. Once installed, the dashboards will be available in the
menu if BI Builder is available on your plan.